Understand what your solar is actually worth.
Solar Tracker imports your live and historical data, applies your real day, night and peak tariff, and tells you the euro value of every kilowatt-hour your panels produce — onsite, exported, and against your payback.
Every watt, in context — not just a number on a dial.
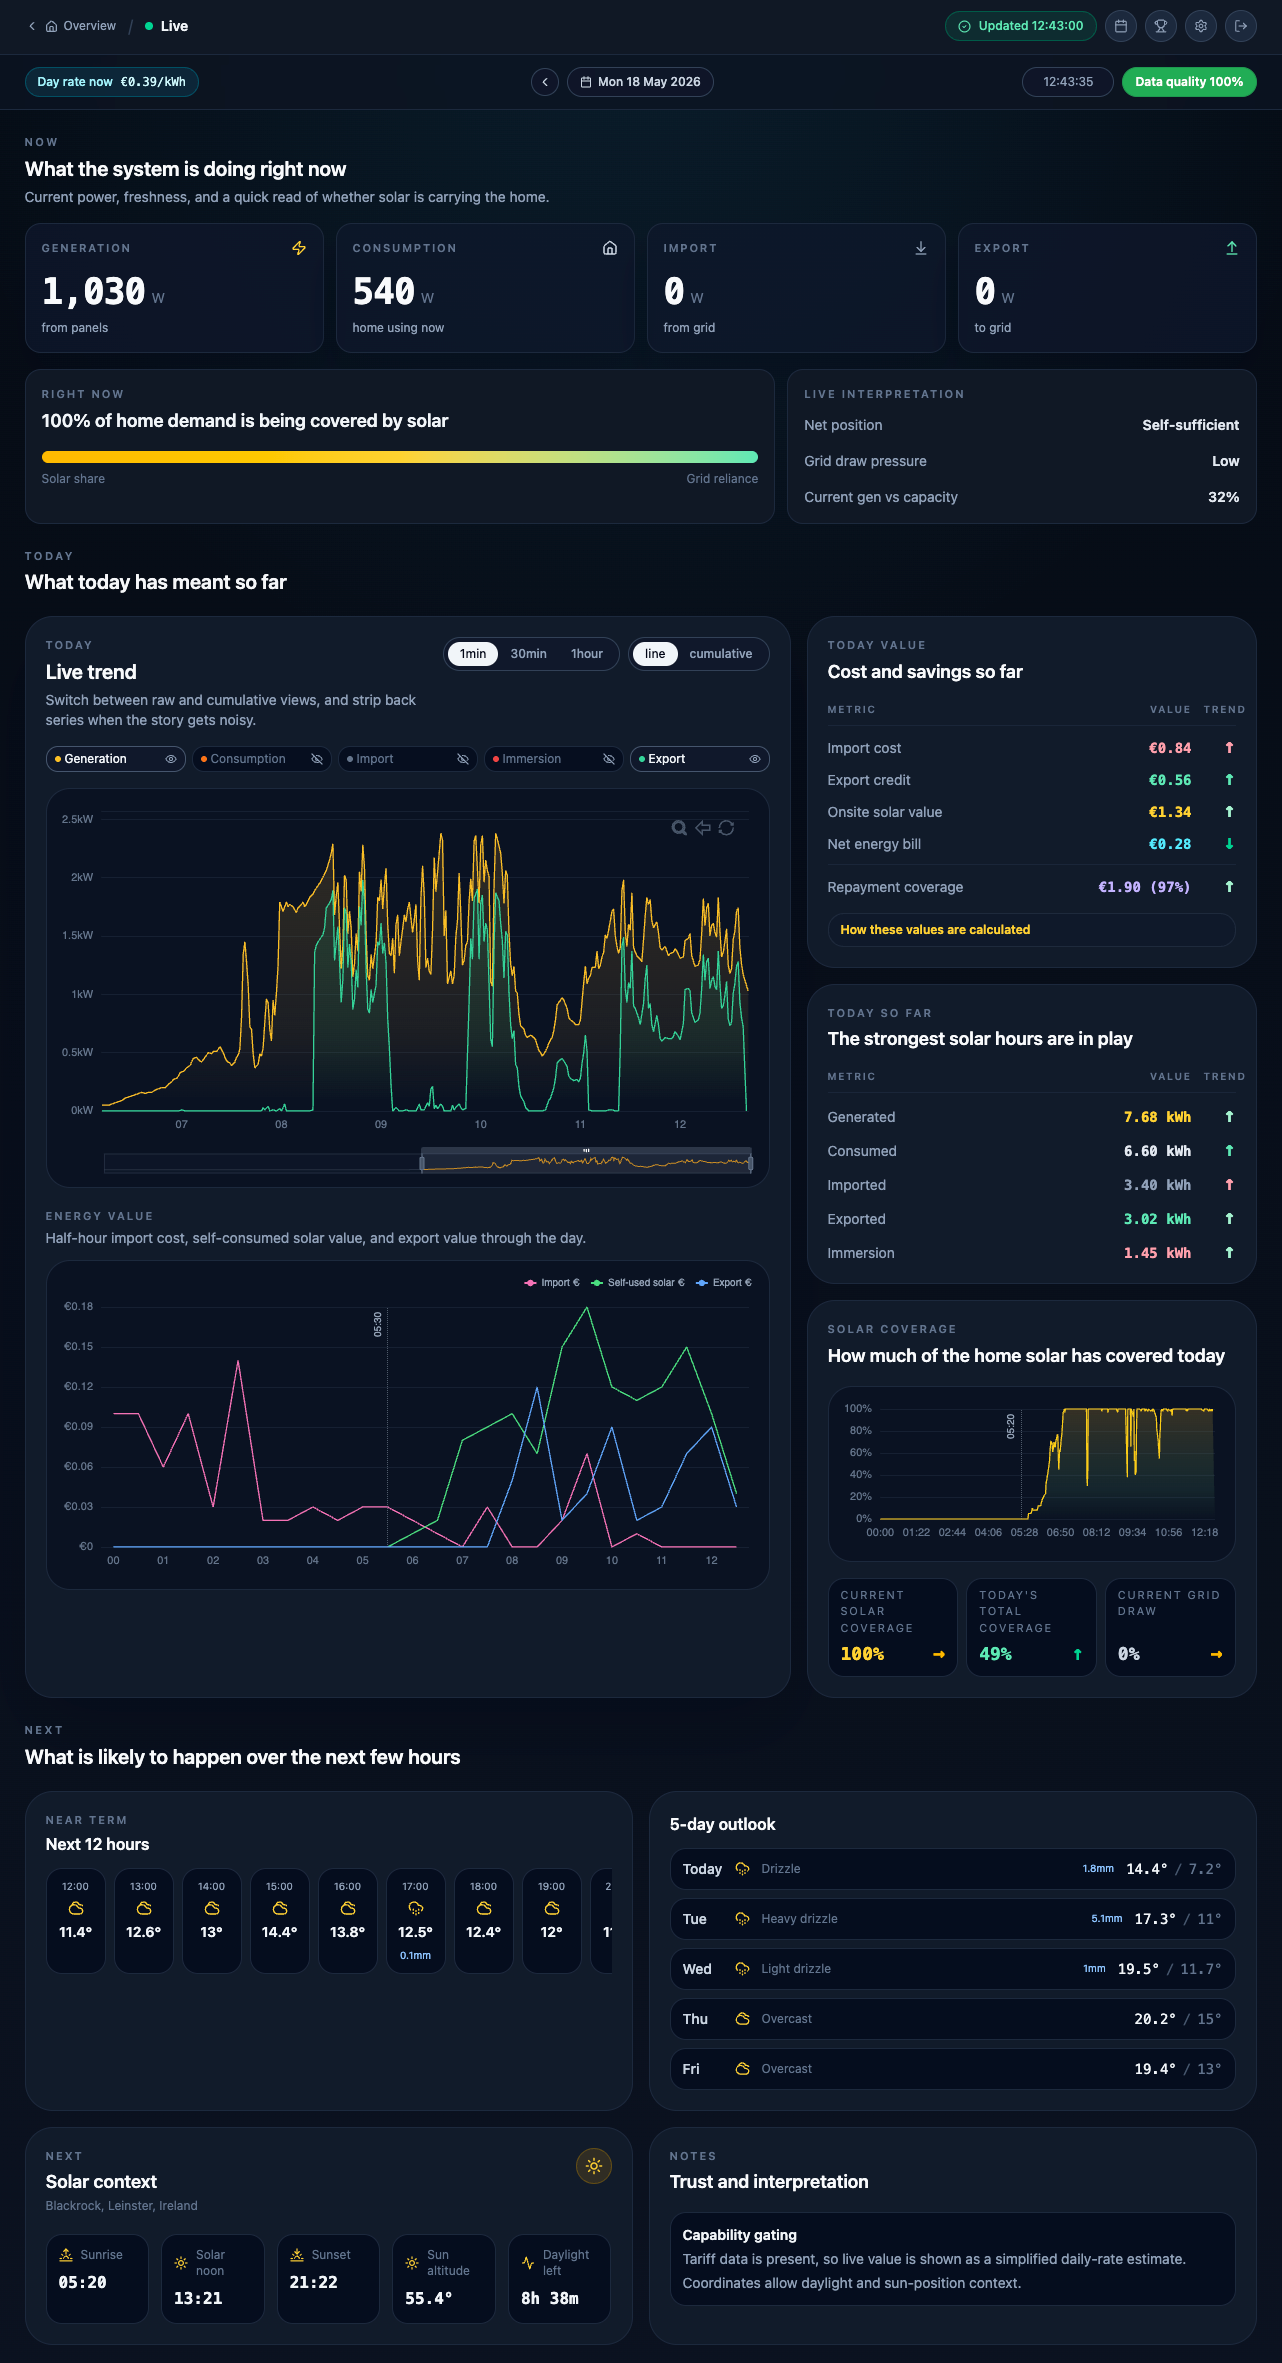
The Live screen shows generation, consumption, import and export — refreshed every minute. Underneath each tile, the interpretation: is solar carrying the home right now, or is the grid?
- Net position, grid draw pressure and current capacity, plain-language— so you don’t need to interpret the graph yourself.
- 1-minute, 30-minute or hourly resolution; line or cumulative view.
- Tariff rate shown in the header, so the savings line is always priced correctly.
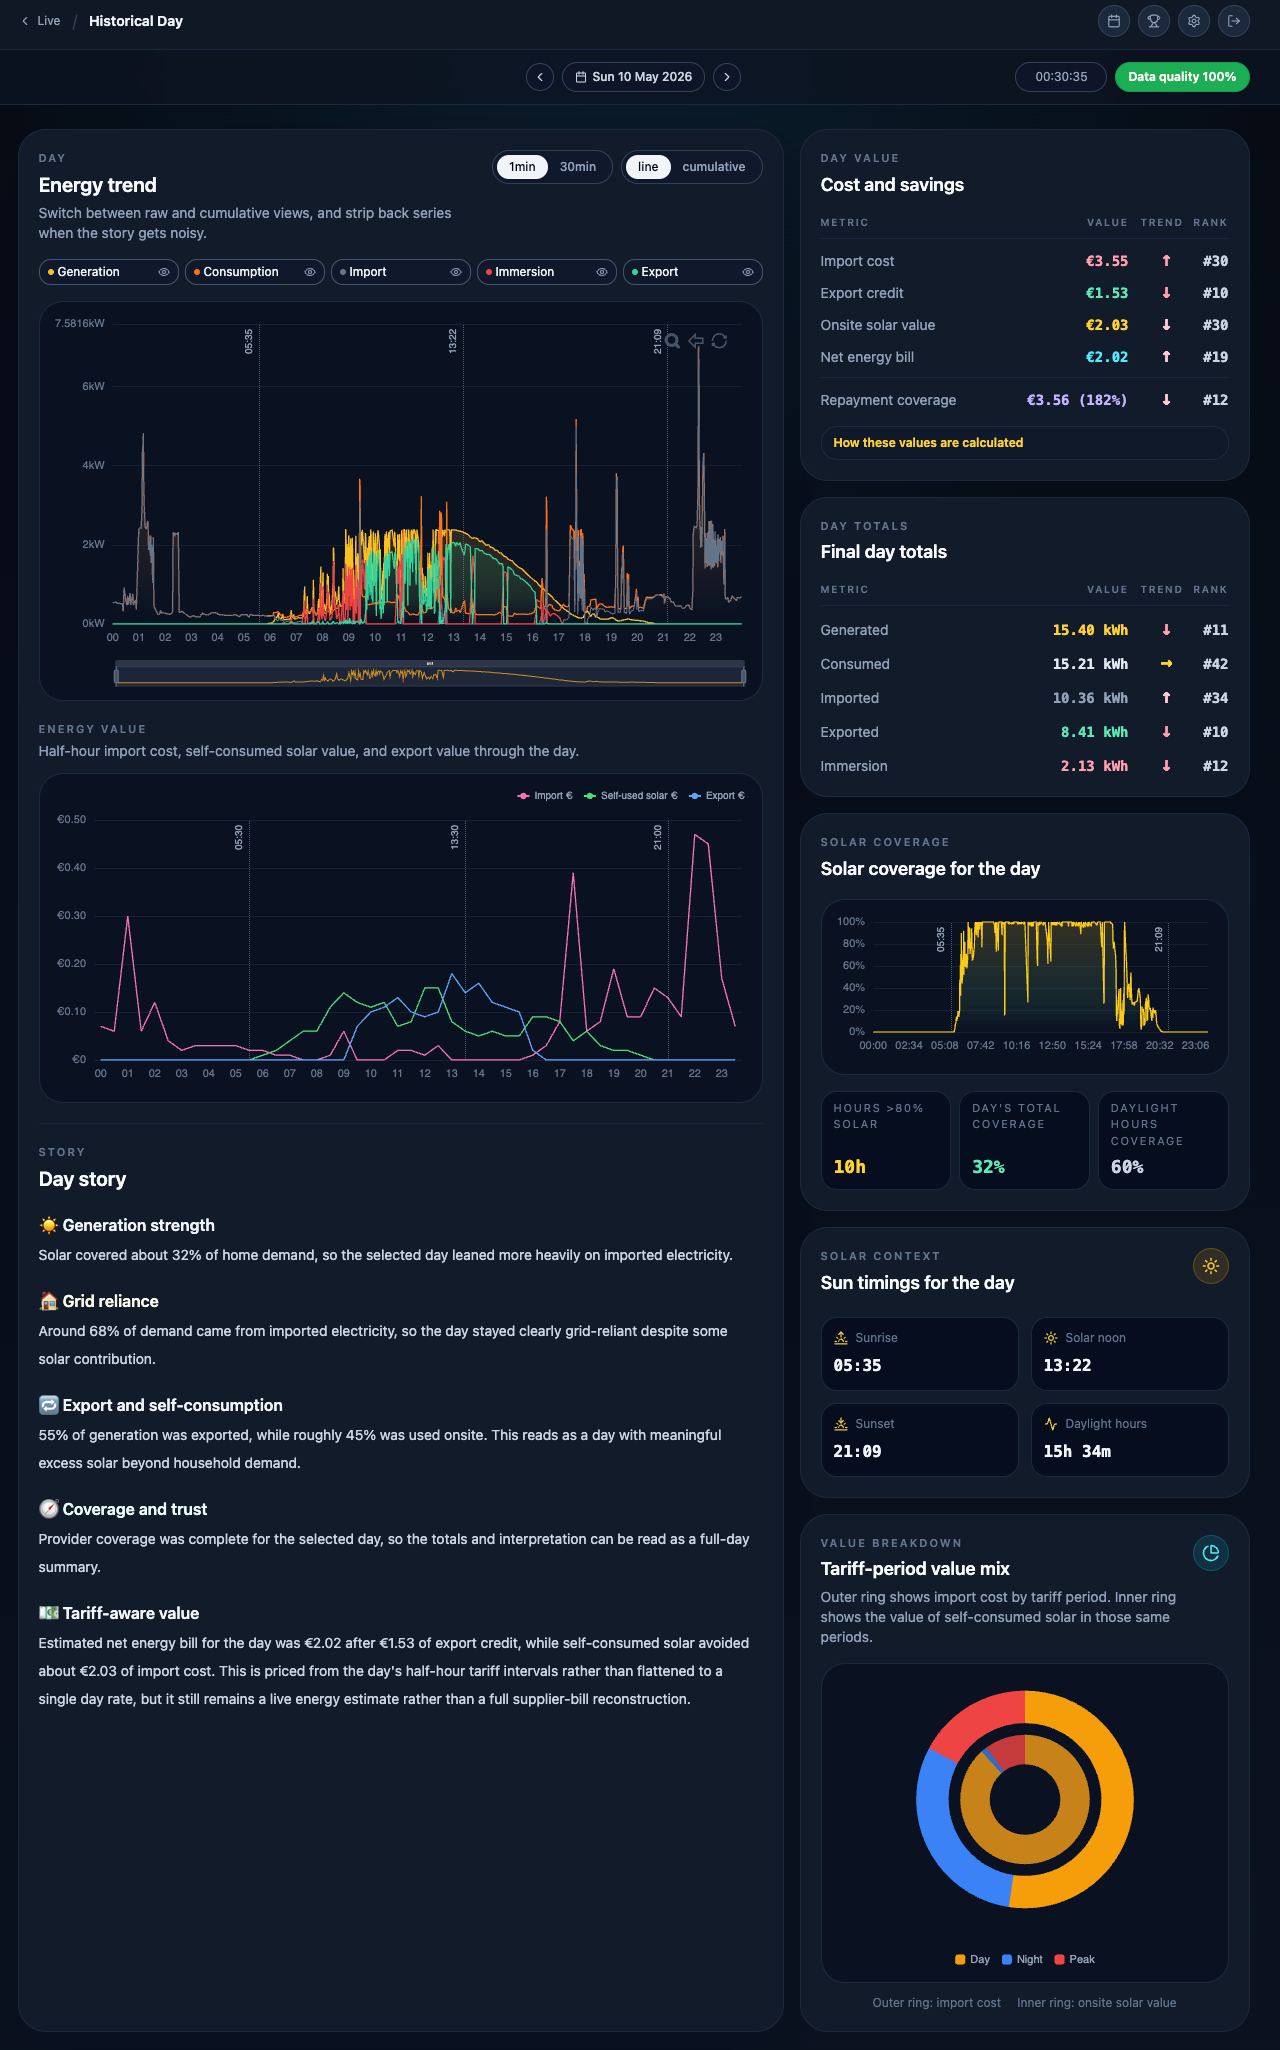
Every half-hour, priced at the rate you were actually on.
Most solar apps tell you watts. Solar Tracker tells you what those watts did to your bill. Tariff changes mid-period? Solar Tracker applies the correct rate to each day automatically.
- Half-hourly cost, self-consumption value and export credit— graphed in euros, not kilowatts.
- Day story written in plain English: generation strength, grid reliance, export and self-consumption balance.
- Tariff-period value mix shows where your euros came from: day, night, or peak.
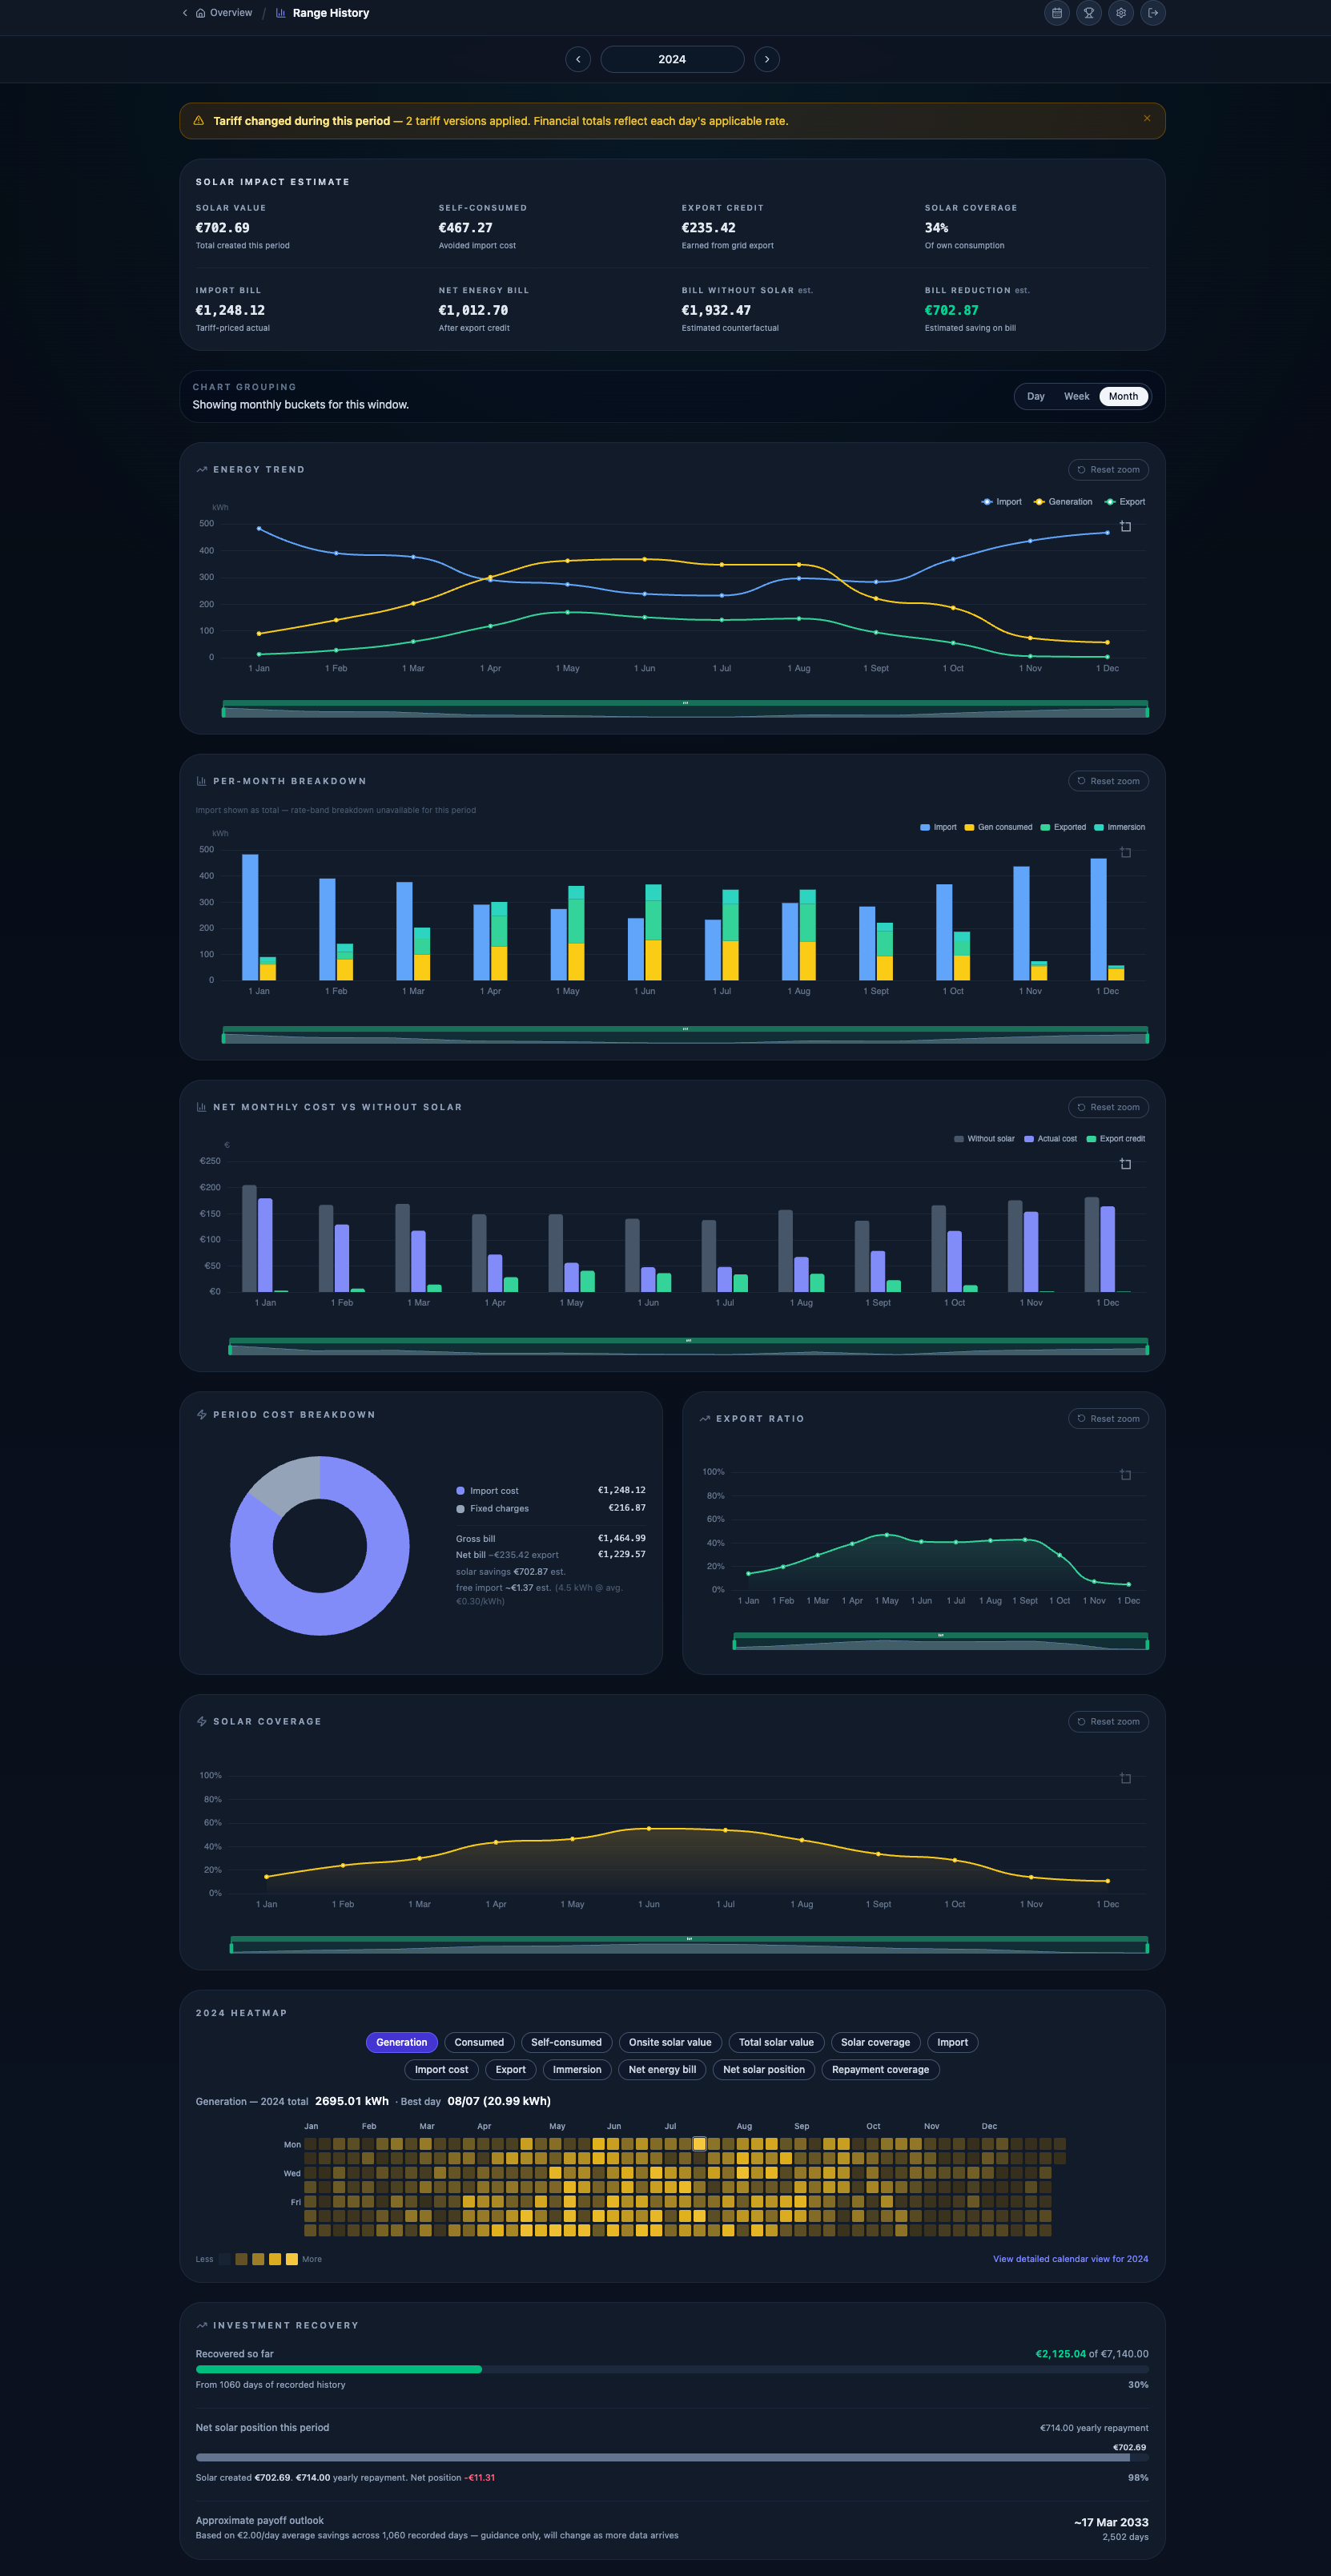
Where are you on your ROI journey?
Pick any window — a week, a season, all of it. Solar Tracker reconstructs your bill with solar against a no-solar counterfactual, month by month, and ticks the recovered portion of your install forward.
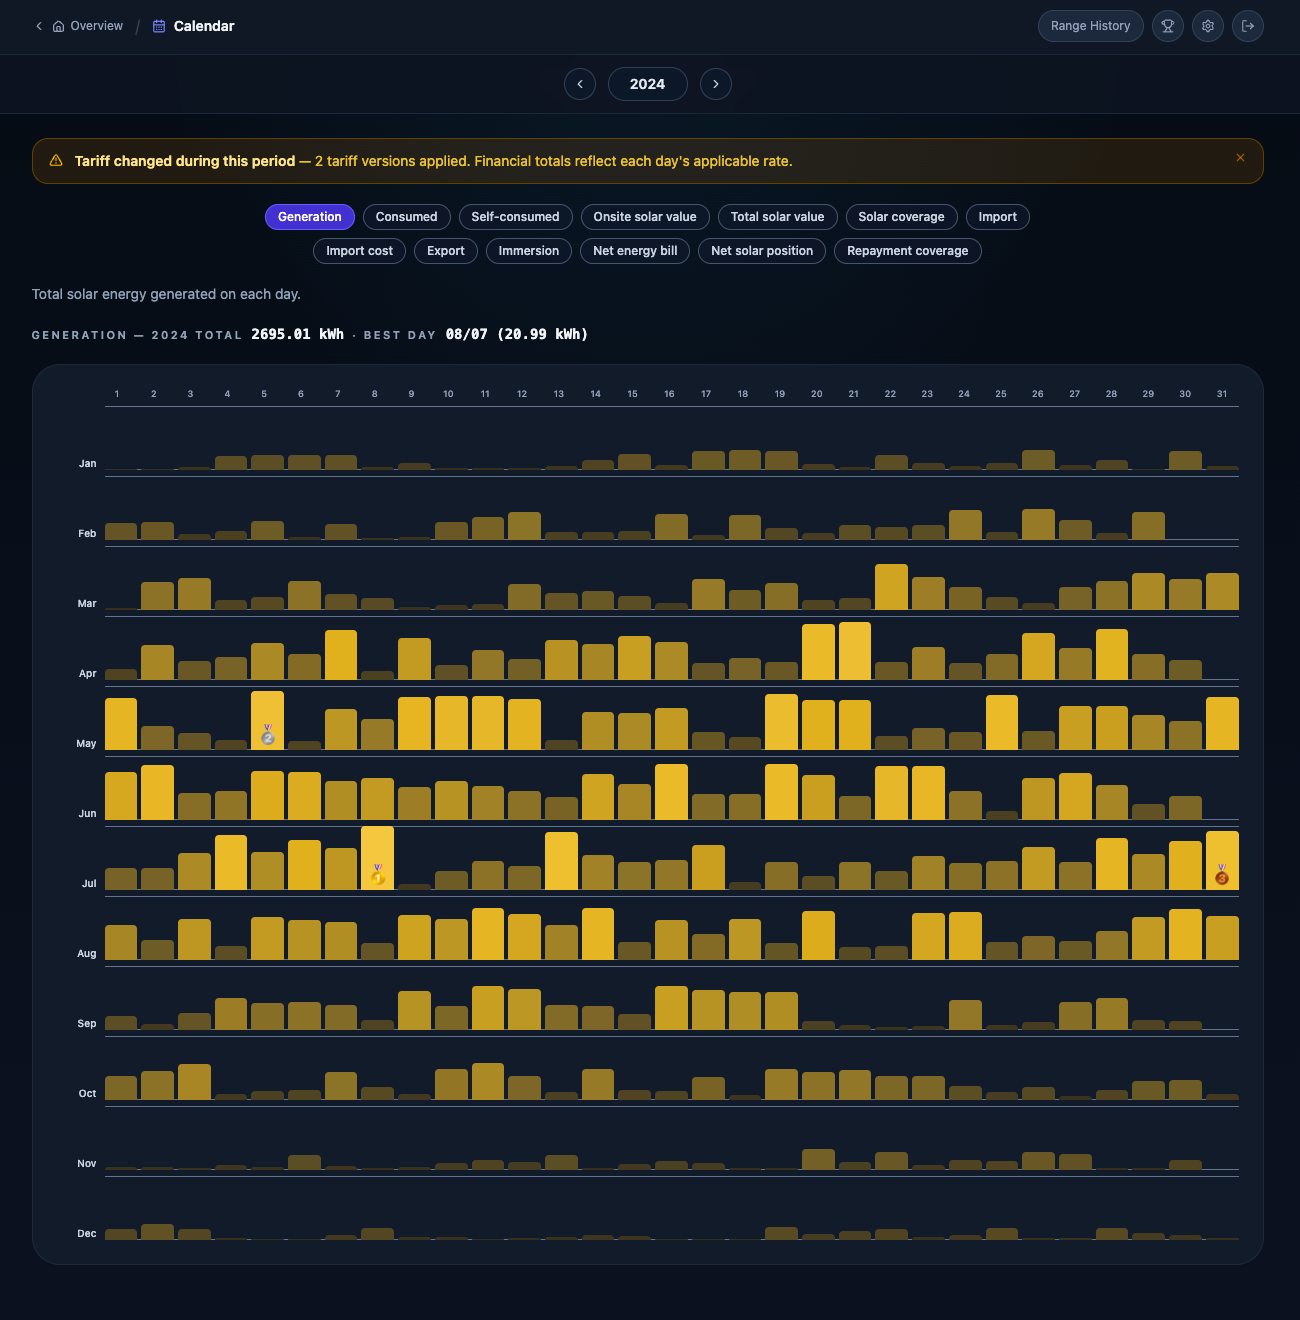
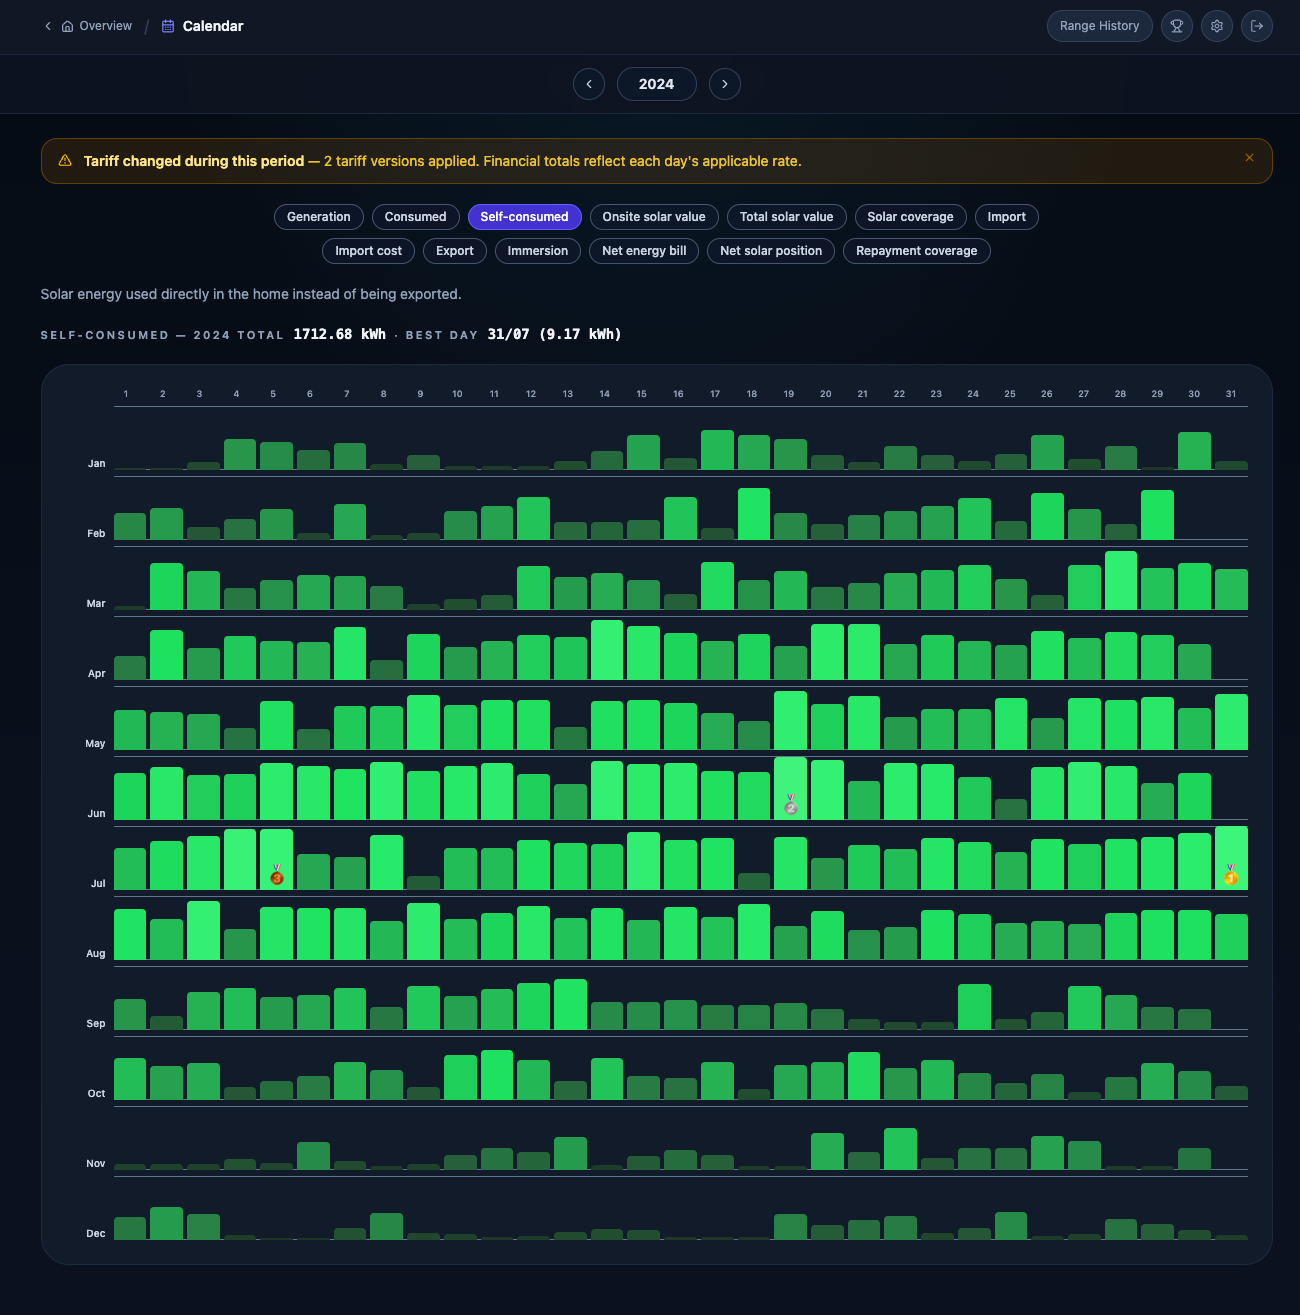
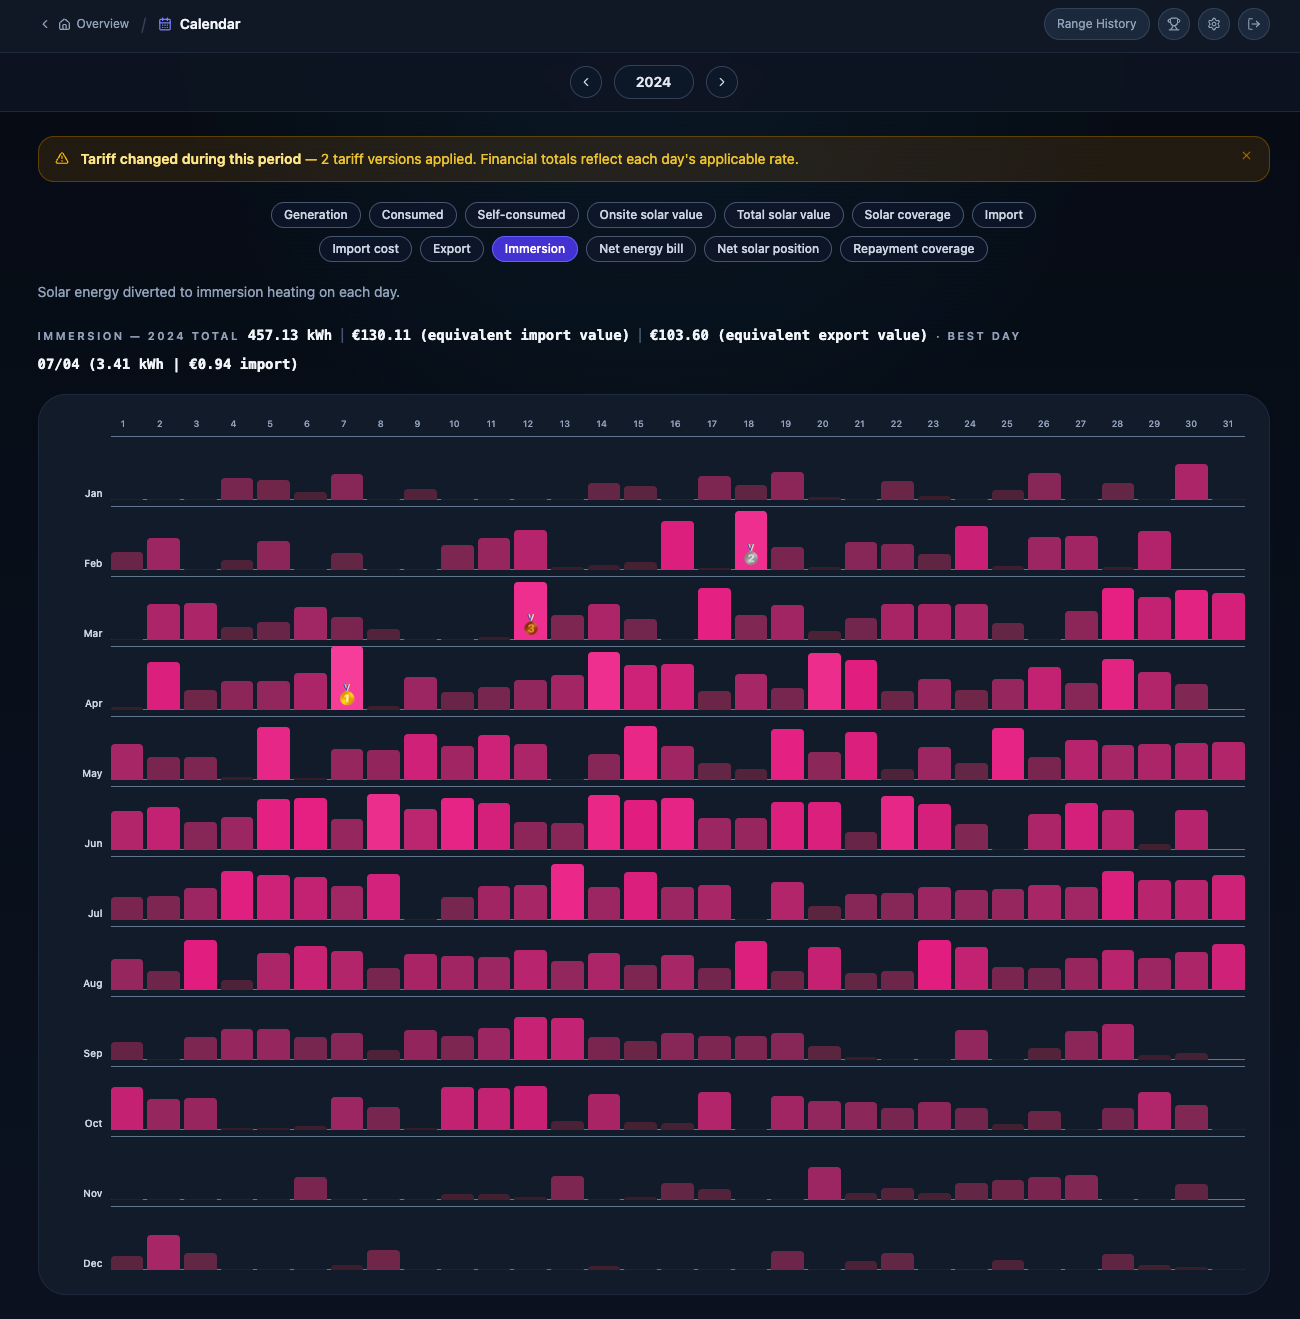
A year of sunshine, on one wall.
365 bars. One row per month. The best day of the year wears a gold medal — it’s the kind of view that makes you feel something about your roof.
- Switch any of 13 metrics: import cost, export credit, coverage, repayment…
- Best day in 2024: 8 July · 20.99 kWh. Annual total: 2,695 kWh.
Your roof has personal bests. We keep score.
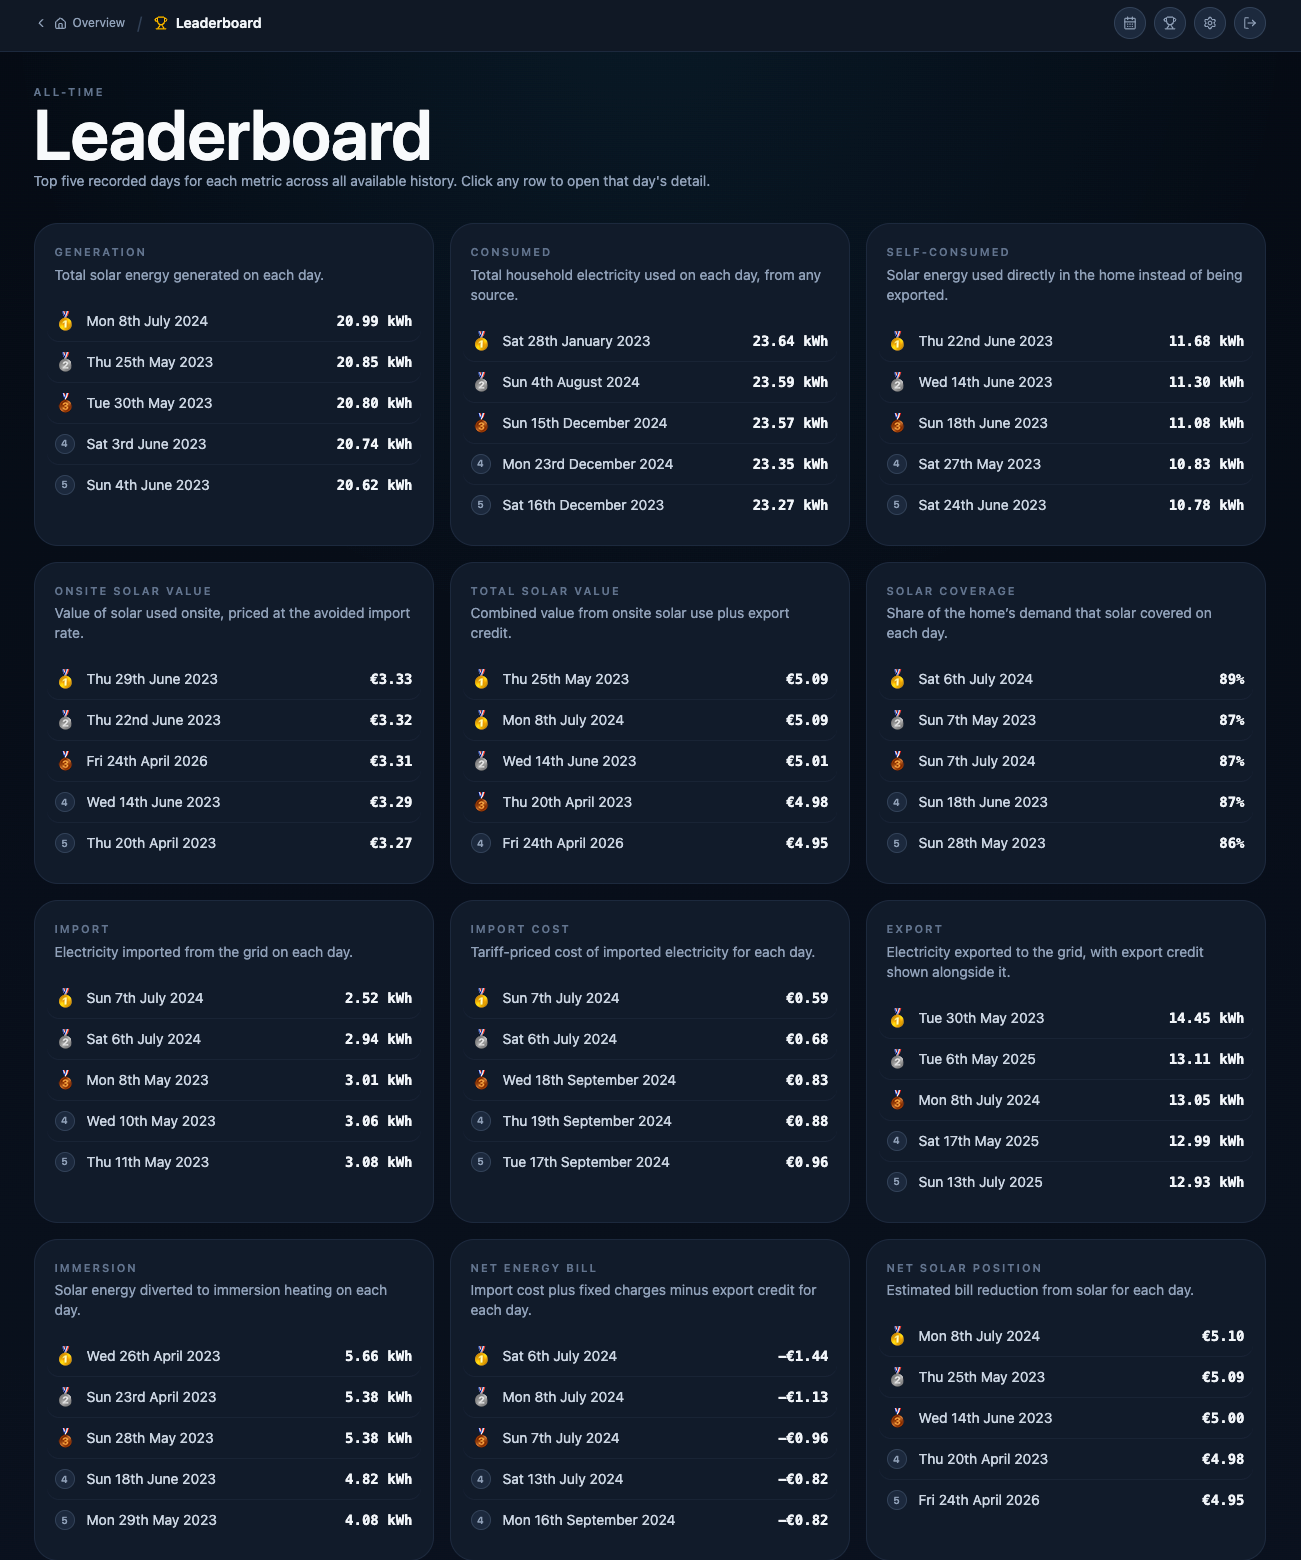
We track all your key metrics and maintain a leaderboard so you can see your best performing days at a glance.
- Generation, consumption, self-consumption, coverage, import cost, export credit, net bill — and more.
- Quickly understand what ‘good’ looks like, then tap any row to open that day’s full breakdown.
Real tariffs give real ROI estimates.
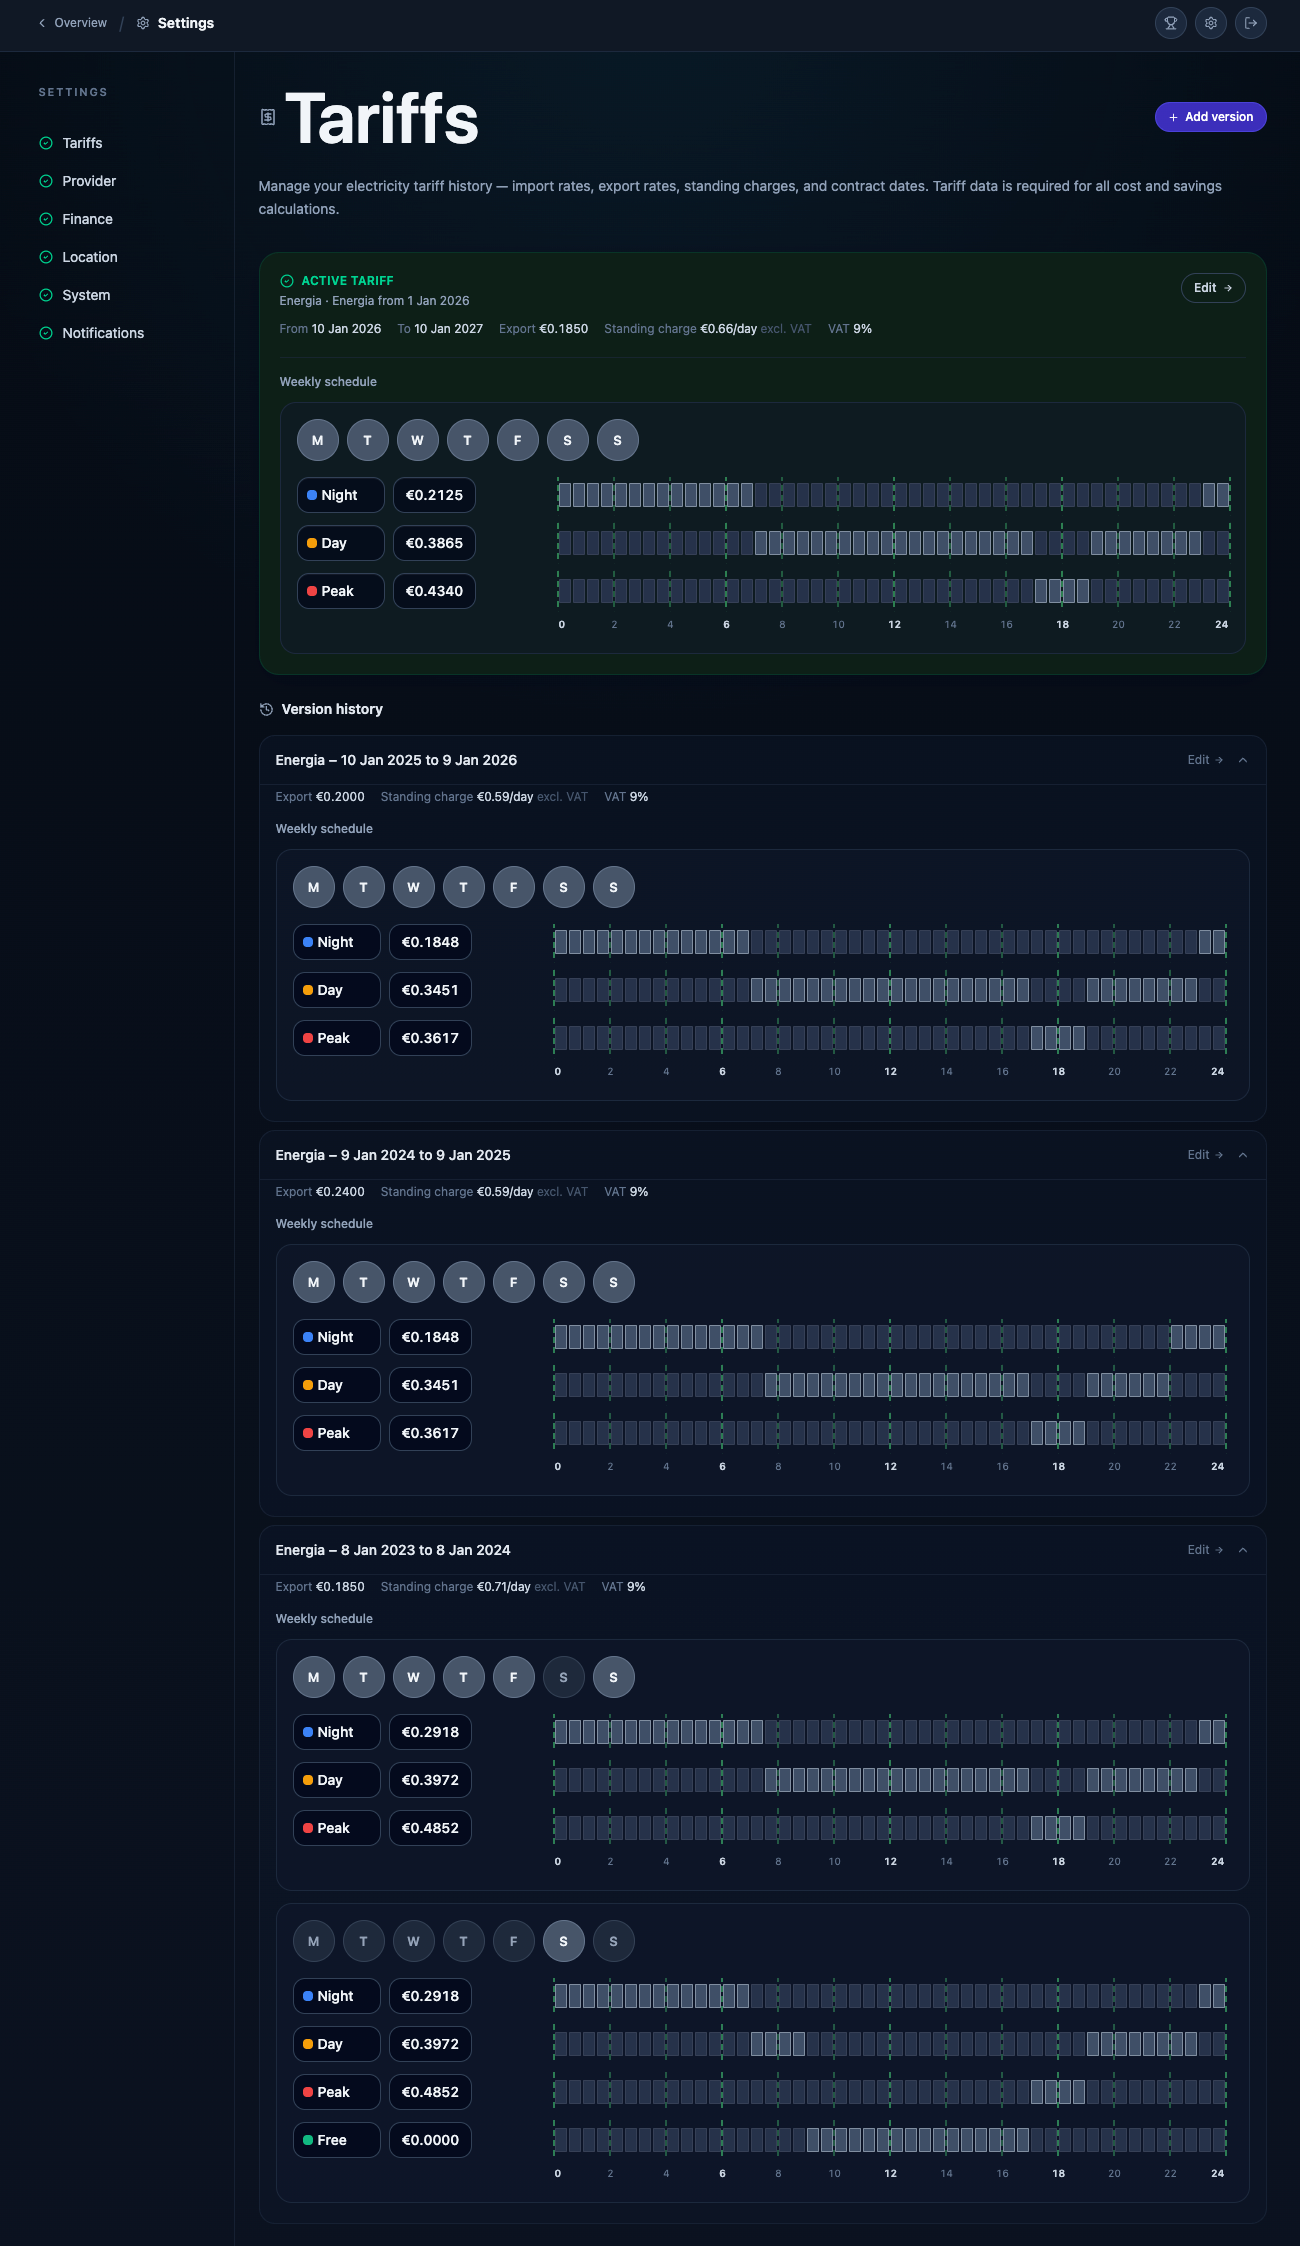
Every euro figure on the dashboard runs through your real tariff schedule. Solar savings are calculated taking your day, night, peak and weekend rates into consideration. Set it once and every kWh, past and future, is priced correctly.
- A flexible tariff editor captures every nuance of your contract.
- Switched providers? Rates changed mid-contract? Add a new version of your tariffs with start and end dates.
- Made a correction? Your historical data is automatically re-priced.
- Export rates and standing charges included — so net bill comparisons are real, not approximate.
- The further back you can go, the more accurately your ROI is calculated.


Designed for desktop and mobile.
Every screen is built mobile-first. Check live generation from the garden, your tariff window at the supermarket, or where you are on your payback on the train home — without losing a chart, stat or feature along the way.
- Same data, same insights— no cut-down ‘mobile version’.
- Live, history, range, calendar and leaderboard all designed to work in one hand.
- Charts re-laid-out for thumb-scrolling, not pinch-to-zoom.
Your data, your control, read-only by design.
Solar Tracker is a window into your data. We correlate and combine it to show you real insights into your system’s performance and ROI. Your data is securely stored and gives you full access to edit or delete it whenever you want.
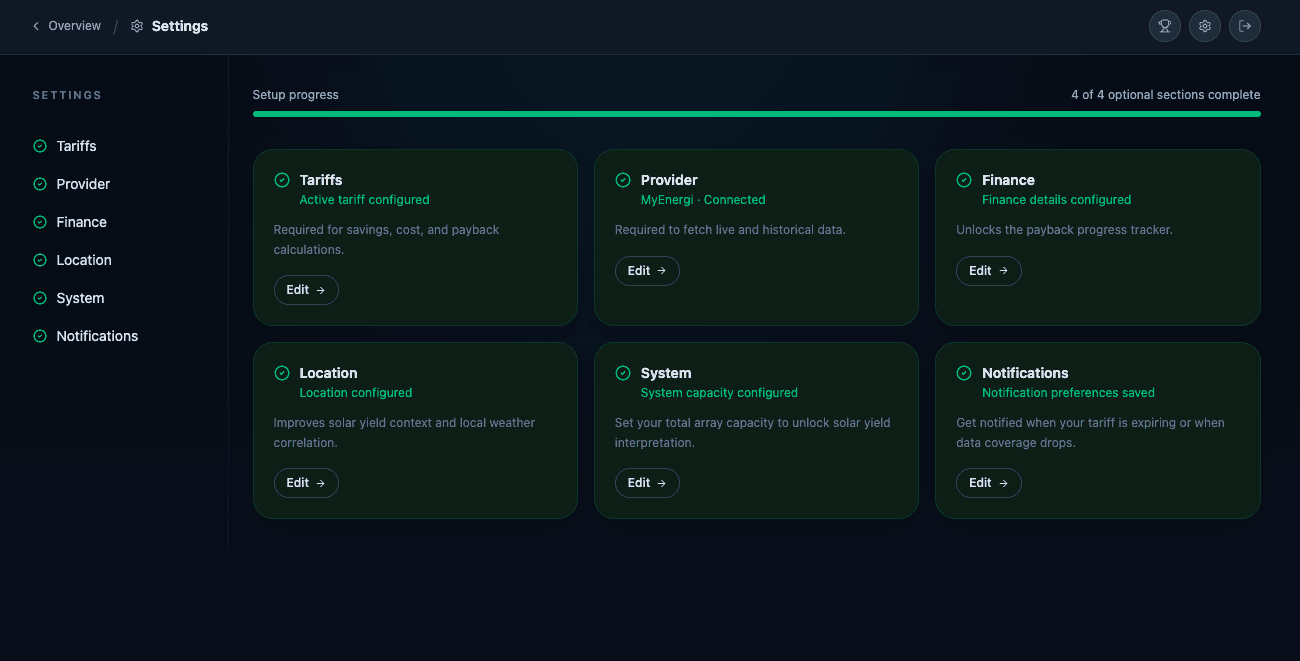
Every aspect of your setup, in one place — yours to edit, delete or disconnect at any moment.
Edit or delete, anytime
You stay in charge of every byte. One button in your account settings removes your data and every derived insight from our systems — no support ticket needed.
Never shared, never sold
No ads, no aggregated insight sales, no third-party analytics on your generation data. It’s used to power your dashboard — and nothing else.
Secure infrastructure
Encrypted in transit and at rest. Solar Tracker is a window into your data — we look through it to give you better insights, we don’t open it for anyone else.
Get real insights into your historical data and return on investment.
Sign up below to request access to the beta rollout, gain early access, and help shape our vision for your data.